Map application help
How to work with the application
The application was developed in ArcGIS API for JavaScript environment. The application runs in all standard browsers without the need to install any plugins or add-ons.
Application tools may be divided into 5 groups as it is showed in the picture below:
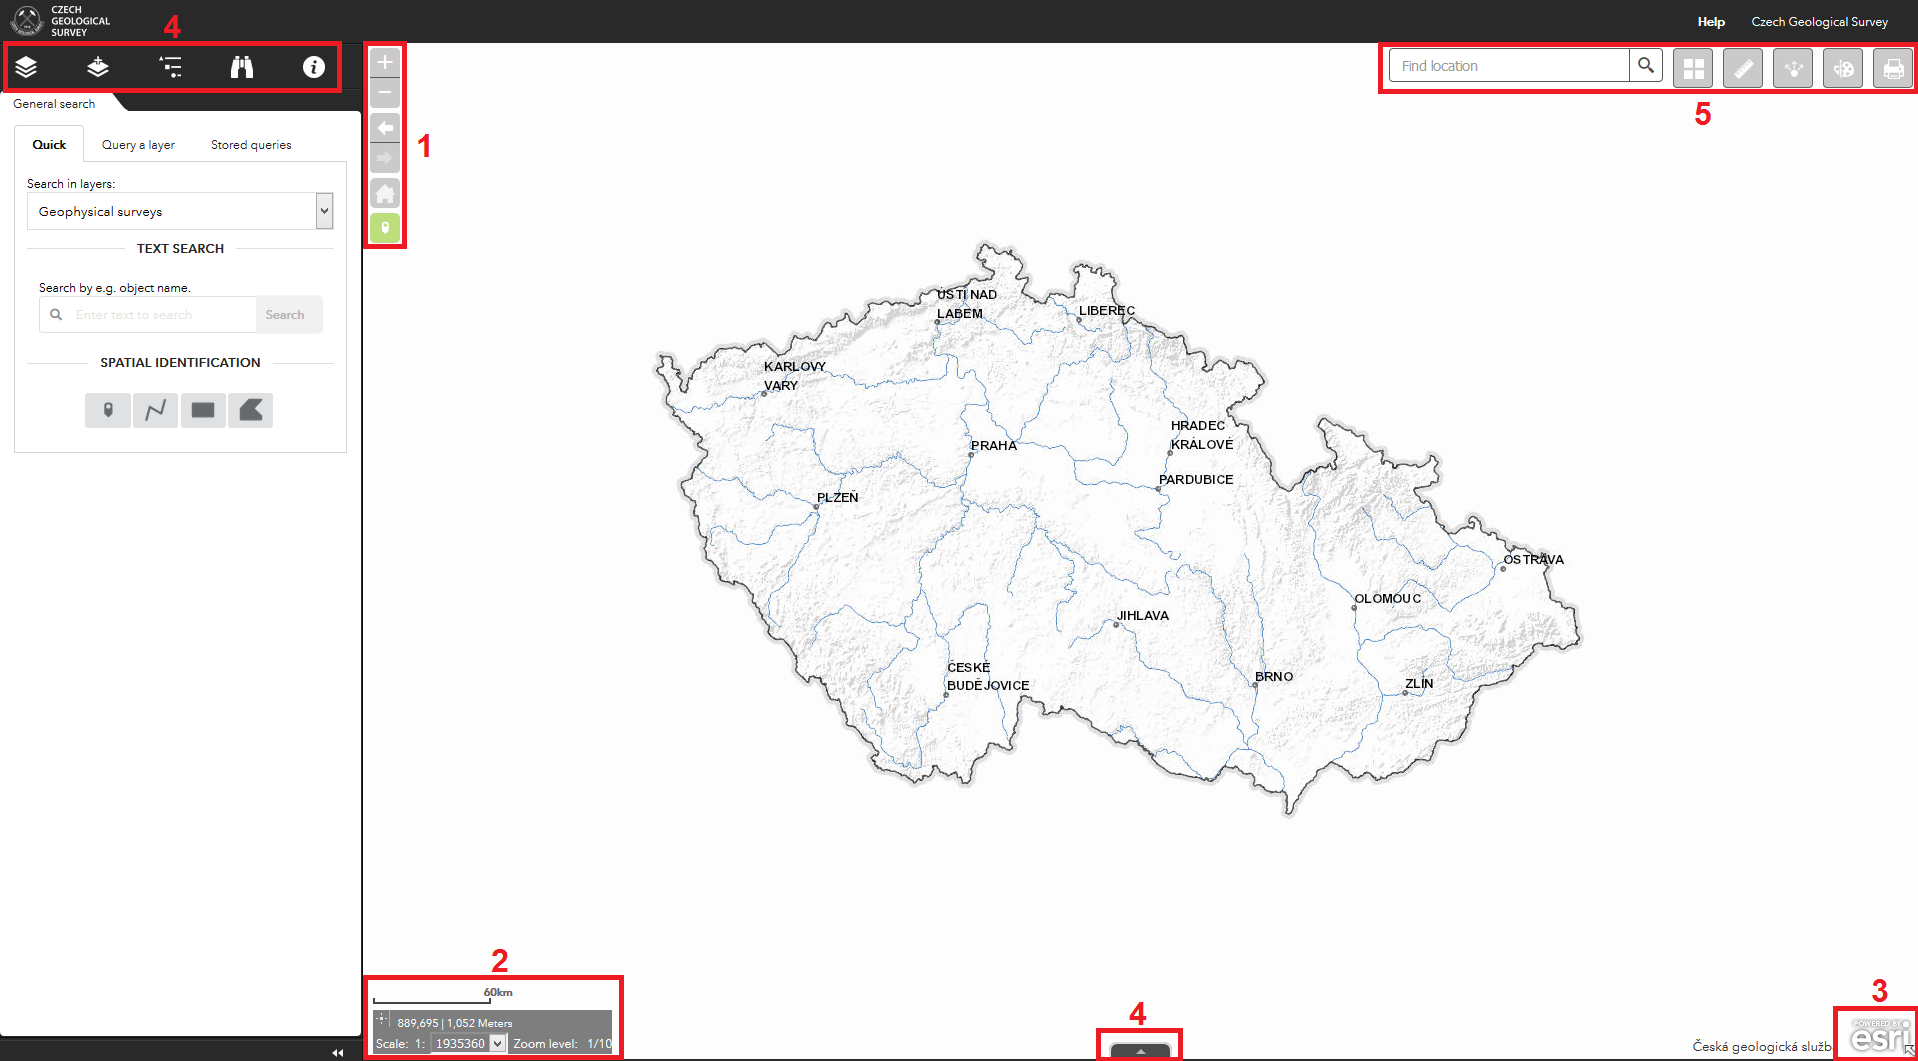
1. Map tools
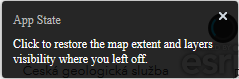 When the application starts, user has the opportunity to pan and zoom to the map extent in which the previous session ended. In a newly launched application, the left toolbox is docked.
See chapter 4.1.
When the application starts, user has the opportunity to pan and zoom to the map extent in which the previous session ended. In a newly launched application, the left toolbox is docked.
See chapter 4.1.
- by scrolling the mouse wheel
- by pressing the shift key and dragging the rectangle in the map
- + and – keys or using the buttons:

Buttons
 enable to move backward or forward in user defined map extents.
 Displays the full map extent.
Clicking into the map shows information on selected feature.
 Select by point is enabled.
 Select by point is disabled. Identification is disabled automatically when the drawing or measurement tool is activated, or when the spatial search query is applied on a layer.
2. View scale and coordinates
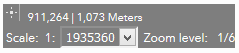 In the bottom left corner of the map window, this tool displays the coordinates of the current position of the mouse cursor in the S-JTSK coordinate system (Datum of the Czech Uniform Trigonometric Cadastral Network). The line below shows the actual scale that informs the user about the level of zoom in the application. 1
 This button activates the tool for the determination and display of the coordinates in the S-JTSK coordinate system (Datum of the Czech Uniform Trigonometric Cadastral Network) of any location in the map. When clicking on the map, the locked coordinates may be copied to clipboard (Ctrl+C) for further use.
To determine the coordinates in the WGS 84 coordinate system, use the Measurement tool in chapter 5.3.
1To enable adding external topographical maps to the application from CENIA or ČÚZK servers (as, for instance, http://ags.cuzk.cz/arcgis/rest/services/zm/MapServer), it is essential to match the scale levels with the provider’s system. These scale levels are deliberately chosen to achieve the highest quality of the displayed map.
3. Overview map
 Overview map can be displayed by clicking on the arrow in the bottom right corner of the map window.
 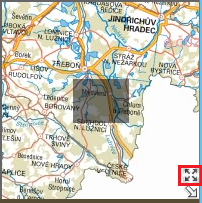 Moving the grey rectangle with the mouse helps to move quickly to another place in the map. The highlighted button enables to expand the overview map to the full map window.
 4. Data tools

Application displays the window with data tools on the left side. Only one tool of the menu may be open at a time.
 Enables to dock the left toolbox so that the map window is maximized.
4.1 List of layers

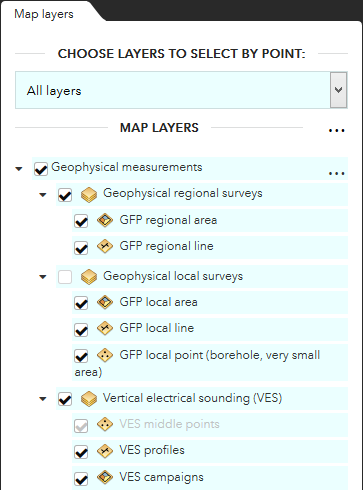 This tool displays map layers embedded in the application, as well as layers added by the user. (See chapter 4.2).
It also defines the layer from which it is possible to make a selection by clicking in the map (identification of features). Selected topic will be simultaneously changed also in the tool General search tool. (See chapter 4.4).
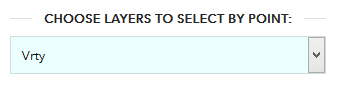
Based on the topic selected from the drop-down menu, the map layers get highlighted. The list of available topics depends on the particular application.
When
All layers option is selected, attributes of all features in the particular place are displayed on the mouse click.
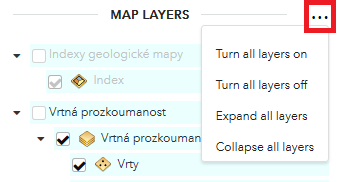 This option enables to switch on/off or colapse/expand all layers in the list.
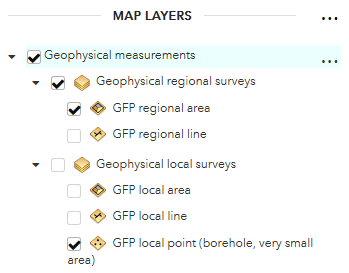
Any map layer may be switched on and off, with the exception of layers loaded as raster tiles.
Grey labels mean that the layer is not displayed at the given scale.
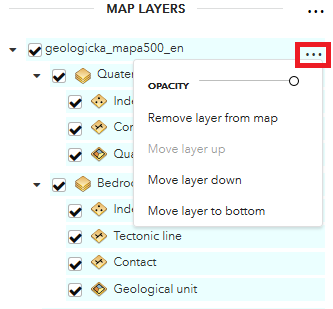 The tool menu for each layer in the list contains the change of transparency of the layer (including its sublayers). Layers added by the user can be removed from the list of layers, re-ordered or moved down in the list of layers.
4.2 Add data

The user has two options how to add layers:
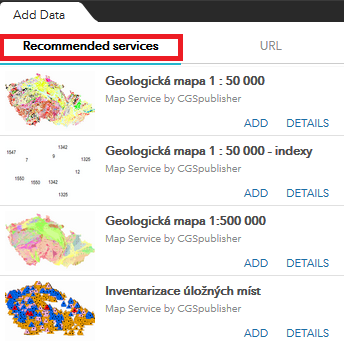 The first tab displays the list of proposed map services provided by the Czech Geological Survey.
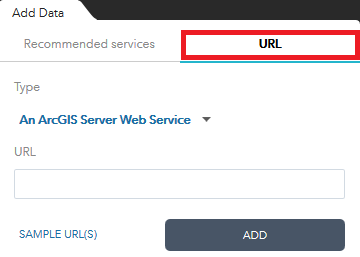 The second tab of the Add data tool enables to insert URL addresses of map services and data files. Sample URL(S)shows examples of formatting of the addresses for different types of services.
The service, which has been added to the application this way, can be removed by clicking on the Layers in the bottom right corner, which displays the list of added services. Clicking on the „recycle bin“ icon removes the layer from the application.
Formats of supported services and data: 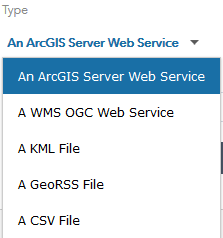
KML, GeoRSS and CSV files must be loaded from a public URL address. A detailed description of the structure of the published file is here.
The list of WMS services can be found on the website of the Czech National Geoportal.
4.3 Dynamic legend

This tool displays the legend of features that are visible in the current map extent. This function is only available for services published by the CGS map server. In all other cases, the legend of the whole dataset will be displayed.
4.4 General search

There are three options how to search through data:
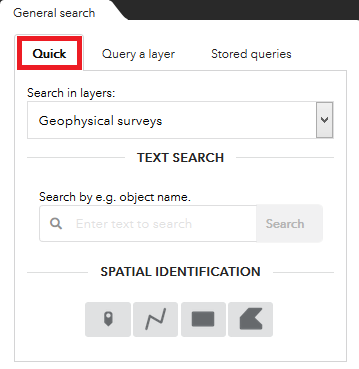 For a quick search, select the queried group of layers and type the text you are looking for, or search for features using spatial queries. The list of available topics depends on the particular application.
For querying all layers in the map simultaneously, All layers must be selected from the menu.
The selection of the group of layers also affects the results of the spatial query (by point/line/rectangle/polygon) – in such case, all features from the given group located in the defined area of interest are selected.
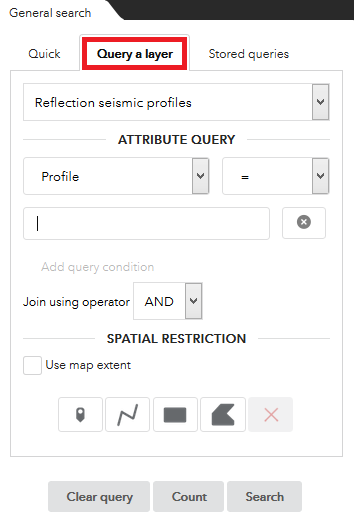 The General search tool has the option to compile an attribute query on a specific layer with possible spatial filters. List of operators applicable for the attribute query =, >, <, <>, like may vary depending on the particular attribute selected.
Only a part of the searched text needs to be filled when using the like operator. The filter is not case-sensitive, but special characters and diacritics (typical for Czech language), if present in the searched text, are required.
Multiple filters can be set and linked by logical operators (AND or OR). A filter can only be defined using attributes of a single layer. The search results are then both displayed in the attribute table and highlighted in the map.
Query may be spatially filtered either to the visible extent of the map (by clicking the appropriate checkbox), or by drawing the point/line/rectangle/polygon in the map.
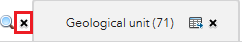
To create only a spatial query on a specific layer, the attribute query dialogue must be closed
x.
By clicking the Clear query button, the query dialogue is cleared. The Count button displays the number of selected features, and the Searchbutton highlights the selection in the map and displays attributes in the attribute table.
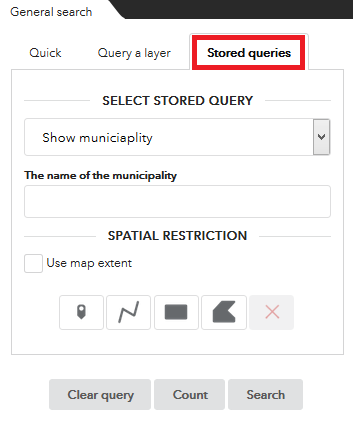 The third search option is to use the predefined queries. Each application contains a set of queries to display any of the following:
By clicking the Clear query button, the query dialogue is cleared. The Count button displays the number of selected features, and the Searchbutton highlights the selection in the map and displays attributes in the attribute table.
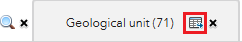
4.5 Table of results
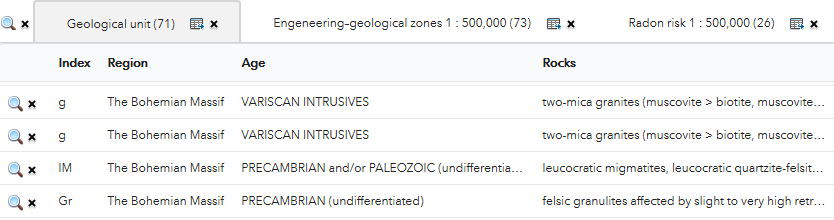
Results of the queries or identification of features are highlighted in the map window and their attributes are displayed in the table of results. By clicking on any line in the table, the line gets highlighted and the map window is panned to display the whole selected feature. User can zoom in on any record in the table  or remove it from the selection.
  .
.
Results are not sorted in the default state. User can sort the table in the alphabetical order by any of the attributes. When clicking on a result, a small arrow appears next to the attribute name in the table header. . Data may be sorted in ascending or descending order.
If the search result contains more layers, each of them displays as a separate table (in a new tab of the table of results) with the following functionality:
 Enables export of selected dataset in CSV format (i.e. to be used in Microsoft Excel application).
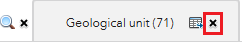 The little cross icon by the layer name removes results from this dataset from the table of results.
 Removes all results from the table.
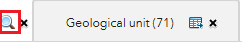 Zooms the map window to all selected records in the table.
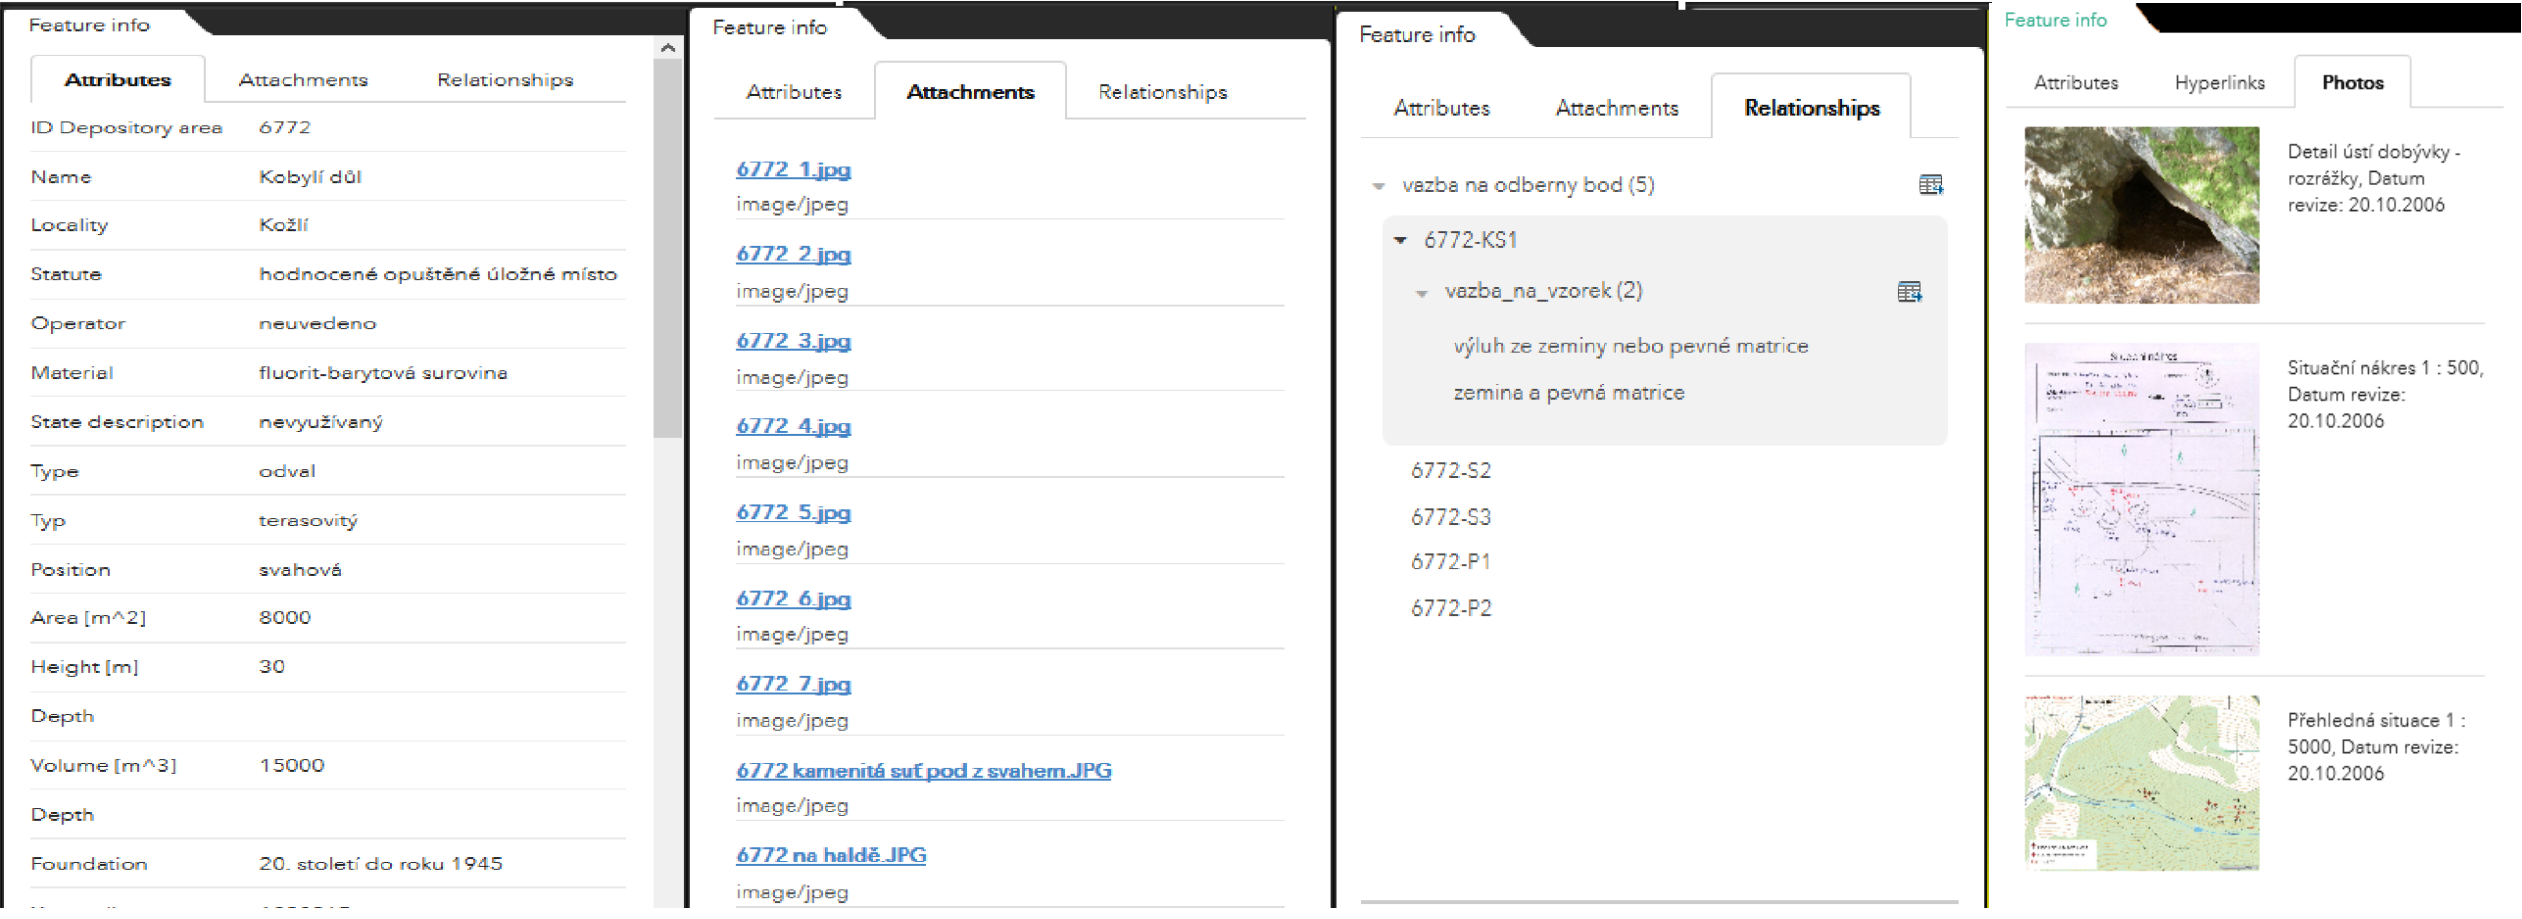
4.6 Feature info

The panel is automatically filled with information from the first item in the table of results. The information is divided to tabs which are displayed according to the extent of available information for each selected feature. Attributes of the selected feature are displayed in the first tab. Links to external documents, graphic attachments related to the feature, relations to other features or thumbnails of documentary photos may also be displayed in additional tabs.
5 Other tools
This group consists of tools for address search, link to maps, measuring, drawing, selection of basemaps and print.
5.1 Search for address/municipality
 This tool enables the user to insert any address within the Czech Republic. For instance, when inserting ”Klárov 3, Praha 1“, the map gets centered on the CGS headquarters.
5.2 Basemap gallery

It is possible to change the basemap in the application. Together with the Base map of the Czech Republic and its modification without vegetation and with shaded relief, an orthophoto map and two sets of archival maps from the II. and III. Military mapping are also available. More information about basemaps are here.
5.3 Measurement

This component is used to measure coordinates, distances and areas on the map. It contains the following tools:
- Display of coordinates – When clicking on the map, this tool displays the coordinates of the current position of the mouse cursor in the coordinate systems S-JTSK (Datum of the Czech Uniform Trigonometric Cadastral Network) and WGS-84. .
- Measuring distances - This tool enables the user to draw a line and measure its total length.
- Measuring areas - This tool enables the user to draw a polygon and measure its area.
- Inserting own points, line or polygon - This tool enables to insert coordinates. It must be in format: [[x1,y1],[x2,y2],[xn,yn]] for WGS84.
- Delete existing measurements
5.4 Drawing tools

The drawing component enables the user to draw and insert custom notes in the map. It is possible to print these notes and sketches using the print component (see section 5.6 Print). When using the Measurement option, the area (or length) of the delineated element is displayed.
By clicking the Clear, the inserted sketches and notes are deleted from the map.
5.5 Sharing hyperlink

This component is used to access the URL link of the current state of the displayed map which can be used to re-open the map displaying the selected location (with the current centre point and scale). It is then possible to copy the displayed link to the clipboard for later use. The map application launched via this link will display layers in their original state; users´ drawings, selections and measurements are not transferred.
More ways for creating special hyperlinks are described in Link Options.
- Current map extent: This is used by default.
- Click the map to define the center of the map with zoom level: A point icon shows under the option when it is checked. Click the icon and click where you want the map to center in the app. A point marker will be added on the map and the URL in the link preview will be updated accordingly based on the map zoom level.
- Click the map to define the center of the map with map scale: A point icon shows under the option when it is checked. Click the icon and click where you want the map to center in the app. A point marker will be added on the map and the URL in the link preview will be updated accordingly based on the map scale.
- Find the location or feature and zoom to it: Input a location in the box, such as Redlands, ca, 92373, or a feature in a searchable layer.
- Query a feature and zoom to it: Choose a layer, a field and a value from the drop:down menus to query a feature and zoom to it.
- Add a marker on the map: Click the point icon and click where you want to add a marker in the map. Fill in the WKID, Pop:up title, Symbol, and Label properties in each text box.
- Overwrite default screen size of mobile layout: Input the screen size in pixels. By default, when either the height or width of a screen display is less than 600 pixels, the mobile layout automatically applies.
- Set display language of the app: Choose a language from the drop:down menu.
- Authenticate a user automatically: Input a token. By default, your log in credentials display in the text box when the option is checked.
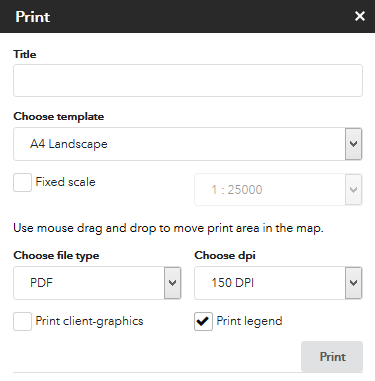
5.6 Print

The print component serves to produce complete printouts in the PDF, JPG and HTML formats. The print dialogue window offers the following settings:
- Title – the possibility to add a title of the map.
- Template – selection from a range of print templates. The “only map” template creates the printout of the map extent visible in the map window.
- Fixed scale – selection of the scale of the output independently on the scale of the map displayed in the application.
- Output format – selection from the available output formats. If selecting HTML, a new print page opens in the browser, from which it is possible to export the map and its legend as an image for use e.g. in a text editor.
- Print quality – possibility to choose the quality of the output.
- Print client graphics – possibility to include the user graphics in the output.
- Print legend – prints the legend describing only items that are visible in the printed area.
If the print component window is opened, the printed area is highlighted (if it is smaller than the current map window extent). The extent of the print depends on the dimensions of the print template selected. After confirmation, the print job is sent to the server; if successfully committed, the final file can be downloaded and printed on a printer in the normal way.